Sidebar
Table of Contents
Debugging Your App
Following are some techniques that can help you find problems in your apps very quickly.
The Validate References button
In ViziApps Studio, Click this button:  . Use it early and often. It will show you errors in your app that absolutely must be fixed before your app will run. For example, this message appears because one of the Data Management queries made reference to a field named “itemKey2” however this field doesn't exist in the app. A common cause for this kind of error is deleting or renaming a field without going back to the Data Management query to update it.

Expose data and events with alert() dialogs
ViziApps is an event-driven system, so you often want to see a specific value just before or just after a specific event. You can easily do this by inserting an alert JavaScript call, which will popup a dialog with any string you want to show. This is an example just before a button launches a data query:
alert( 'The key is: ' + getFieldValue( 'primaryKey' ) );
Console log messages
You should be able to debug most or all of your app's user experience and data management design using the Preview App feature - it's the quickest method to verify that an app looks and behaves the way that you indend it to. But there is another great advantage: you can use your browser's JavaScript Console to get important information. If you have entered some customized JavaScript with a syntax error that prevents it from running, the JavaScript Console will display the error. You can also write any text and expose any field value or variable to the console:
console.log( 'The key is: ' + getFieldValue( 'primaryKey' ) );
Here are the instructions for launching the JavaScript Console in Mozilla FireFox and Google Chrome.
It is fairly easy to see the console.log output from your iOS device; follow these instructions for Getting Console Output Without Xcode:
- Plug in the device with a USB cable and open iPhone Configuration Utility
- Select the device under DEVICES in the left-hand column
- Select the Console tab
- Press the “Save Console As…” button in the lower right of the window to export the Console log.
Viewing the console.log output from Android devices is a more complicated process. There is an Android app called aLogcat which lets you view the log output directly from the phone. You could view the output from the command line using the adb logcat command, or using the GUI tool DDMS.
Stringify JavaScript objects
A field value or JavaScript variable that you may need to verify could be more complex than a simple string. For example, you may have a data query that loads a table with 2 test fields and a hidden field. The text fields will be visible in the table, but how do you know if all of the hidden field values are correct? If you defined a table with a hidden field named tablePrimaryKey, then you could show all of the values into the console with this statement:
var tableValues = getFieldArray( 'tablePrimaryKey' );
// for single-line output:
console.log( 'Values: ' + JSON.stringify( tableValues  ) );
// for multi-line formatted output:
console.log( 'Values: ' + JSON.stringify( tableValues, null, '  ' ) );
Make hidden fields visible
Hidden fields ![]() are used in many situations where some piece of information needs to be stored but shouldn't be seen by the user, for example the URL of website that is used by a button event to launch a web page. But since the hidden field is hidden, it may have an unexpected value and you can't see that error, which frequently happens when first debugging a database query.
are used in many situations where some piece of information needs to be stored but shouldn't be seen by the user, for example the URL of website that is used by a button event to launch a web page. But since the hidden field is hidden, it may have an unexpected value and you can't see that error, which frequently happens when first debugging a database query.
An easy way to find out whether a hidden field has the correct value is to define it as a Text Label field instead. The resulting layout may not be pretty, but for debugging, it will show you the exact value. Then when the feature has been tested, you can change the Text Label field back to a Hidden Field.
Testing data connections
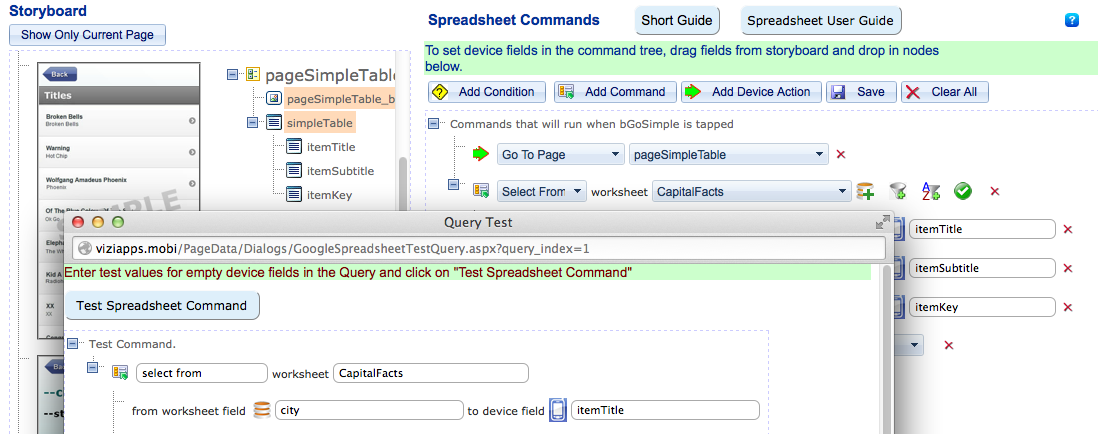
When you are building queries with Manage Data, click on the Test Data ![]() icon to bring up a query test page that you can use to send a live query to your database and review the results. Note that when using the Test Data feature in ViziApps Studio, you are accessing the database using the credentials of the administrator account that you used to establish the data connection, which may be different than the credentials of the end-user.
icon to bring up a query test page that you can use to send a live query to your database and review the results. Note that when using the Test Data feature in ViziApps Studio, you are accessing the database using the credentials of the administrator account that you used to establish the data connection, which may be different than the credentials of the end-user.


